Many of the issues that we councillors are contacted about relate to highways maintenance. We’ve previously shared information about the council’s approach. This has been updated here with a round-up of the latest information. Unfortunately, the story is still of massive underfunding, for all councils, including Stockport Council.
The scale of Stockport’s highway network
The highways network in Stockport is an asset owned by the council, worth approximately £1.1bn, if it had to be rebuilt, it has approximately 35,000 streetlights and 74,000 highway gullies.
It’s good practice to assume 10% of the network is at risk and in need of maintenance at any time. It is estimated that the council should be spending £8-10million per year on maintenance. However, national policy has tended to favour funding for new road building over maintenance.
With regards to ongoing maintenance, under the City Region Sustainable Transport Maintenance Settlement, Stockport gets approximately £4m per year. This needs to fund highway and footway maintenance in addition to flood defences, structural repairs and a range of other expenditure.
This leaves approximately £1.5 million per year for road maintenance, significantly lower than the £10m required. So, this has to be invested on a risk approach to areas of greatest need. Which is why funding for drains clearance, amongst other things, is limited, and in some cases much lower than we might wish.
The Highways Investment Program
Several years ago, the council set up the Highways Investment Program, the ‘Investing in Stockport’ initiative. This was a ten year commitment to invest £100 million funding to improve roads and footpaths across the borough, also to carry out a range of repairs from patching, to resurfacing in targeted areas. This funding concluded in 2023/24 and means that the Stockport network is now in a better position than a number of other local authorities.
The council has been awarded an additional £1.8m in road maintenance funding in 2025/26, which is helping provide additional resilience. But this is still under what the council estimates is needed to maintain the highway in its current state. As part of a requirement for the additional funding, Stockport has recently published some significant information on cost etc of our maintenance works here: Local Highways Maintenance Transparency Report 2025 – Stockport Council
Whilst additional funding is welcome, the overall costs of undertaking preventative and reactive maintenance work is becoming more expensive due to labour, fuel and materials inflation. This means that fewer improvements per £1 spent are being delivered year on year.
As the amount spent on preventative maintenance does not match the estimated requirement, the amount the council needs to spend on reactive maintenance (colloquially known as potholes) is increasing year on year. It is always better value to spend on preventative before reactive, but the council has legal requirements and time limits linked to emergency repairs that it is obligated to undertake. It is not a case of just being able to take some of the funding spent on reactive maintenance and apply it to preventative maintenance.
How Stockport compares to others
The council was recently ranked against other authorities across England and scored an overall rating of AMBER, but specifically:
Green – spending commitment
Amber – highway condition
Amber – use of wider best practice
The council continues to invest, and seek more efficient ways of working. It will continue to keep residents updated through this spending period of efforts to utilise the increased governmental funding commitment.
You can report issues and comments here:
Report an issue or give feedback – Stockport Council
National factors affecting local roads
The LGA have written about the “constraints and headwinds” facing all local councils who have responsibility for highways. We thought it important to make clear that these are national issues:
Funding constraints
Limited and often short-term funding allocations hinder strategic, long-term investment in road maintenance. High inflation over recent years has meant that many authorities have faced a real terms cut in the size of their maintenance budgets.
Backlog of repairs
Years of underinvestment have created a significant backlog, requiring reactive treatments that are more expensive and less effective. In 2019, DfT estimated there was a £7.6 – £11.7 billion backlog of maintenance work. But the Asphalt Industry Alliance’s 2025 ALARM survey estimated this had risen to £16.8 billion.
Ageing infrastructure
Historic road-building practices and materials may not be suited to modern traffic volumes and climate conditions. Life-expired bridges and old concrete block roads are two common examples of this.
Increasing traffic loads
Heavier and more frequent traffic, including HGVs, accelerates road wear and deterioration.
Changing requirements
Many councils are increasingly keen to support active travel modes such as cycling. These use different areas of the highway surface (e.g. closer to the kerb than cars) and users may be more at-risk to injury from potholes than car drivers. This could require councils to prioritise pothole repairs that would previously have been seen as low priority.
Streetworks and utility excavations
Increasing demand by utility companies has led to more streetworks which can degrade road surfaces and disrupt planned maintenance.
Workforce capacity
Many local highway authorities and construction companies report issues with an ageing workforce and a limited supply of new skilled workers. This creates competition between authorities and risks losing expertise as the sector’s workers approach retirement. This also leads to risks around the sector’s ability to absorb the latest innovative technologies and techniques.
Climate change
A long-term increase in rainfall and extreme weather conditions will accelerate deterioration of the road network. This creates new demands on funding, with infrastructure needing to be more resilient to changing weather patterns.
Imperfect information on highway assets
Councils don’t always have full information on the exact condition of their highway network today, and it is difficult to predict where the highest risk issues are likely to emerge in the future. Many highway authorities manage vast networks with a diverse mix of roads from A roads through to unclassified country lanes
Source: Improving highways maintenance productivity | Local Government Association
Stockport’s performance against other metropolitan councils
To illustrate Stockport’s performance against other metropolitan councils, the graph below shows that expenditure per head on highways and transport services was £85.62, compared to the national average of £72.08 for all English metropolitan boroughs:
Total expenditure – Highways and transport services per head of population (RSX) (2024/25) for All English metropolitan boroughs


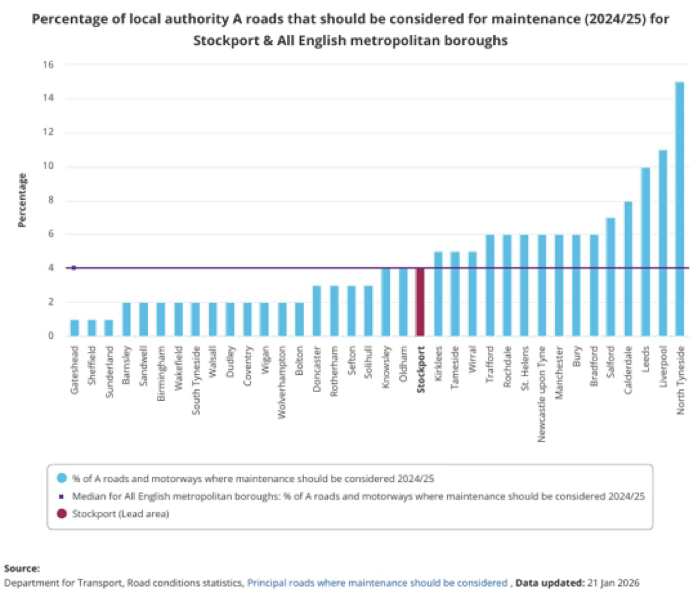
Percentage of local authority A roads that should be considered for maintenance (2024/25) for Stockport & All English metropolitan boroughs
The graph below shows the percentage of A roads which should be considered for maintenance in Stockport, which is 4%, the same as the national average for all English metropolitan boroughs

Percentage of local authority B and C roads that should be considered for maintenance (2024/25) for Stockport & All English metropolitan boroughs
The graph below shows the percentage of B and C roads which should be considered for maintenance in Stockport, which is 6%, the national average for all English metropolitan boroughs is 5%
